English
Solar panels are actually reassuringly simple: when sunlight hits them, they generate power. The more sunlight, the more power. Therefore, the best days for power production are the ones with no clouds in the sky, where the sun shines on the panels from sunrise to sunset.
On such days, we see the power gradually increase to a high value and then decrease again at the end of the day: a perfect bump is the result. However, on days with alternating sun and clouds, the power production graph looks very different: erratic peaks and dips show the power spiking up and down with each passing cloud.
What you don’t see on the output graph, but you do see if you look at the ‘real-time’ display (or ‘smart screen’) of the inverter, is that on days with sun and clouds, sometimes extreme surges seem to occur. At certain moments, the power jumps from low to very high, even higher than on cloudless days, before quickly dropping back again. This phenomenon is called the ‘edge of cloud’ effect.

When a cloud passes, the panels get a boost due to light reflection from the cloud
When a cloud passes by, the panels are temporarily in the shade. The power production drops significantly, and the temperature of the panels also quickly decreases. By now, you’re probably aware of how strongly the temperature of solar panels relates to their power production: cooler panels perform significantly better.
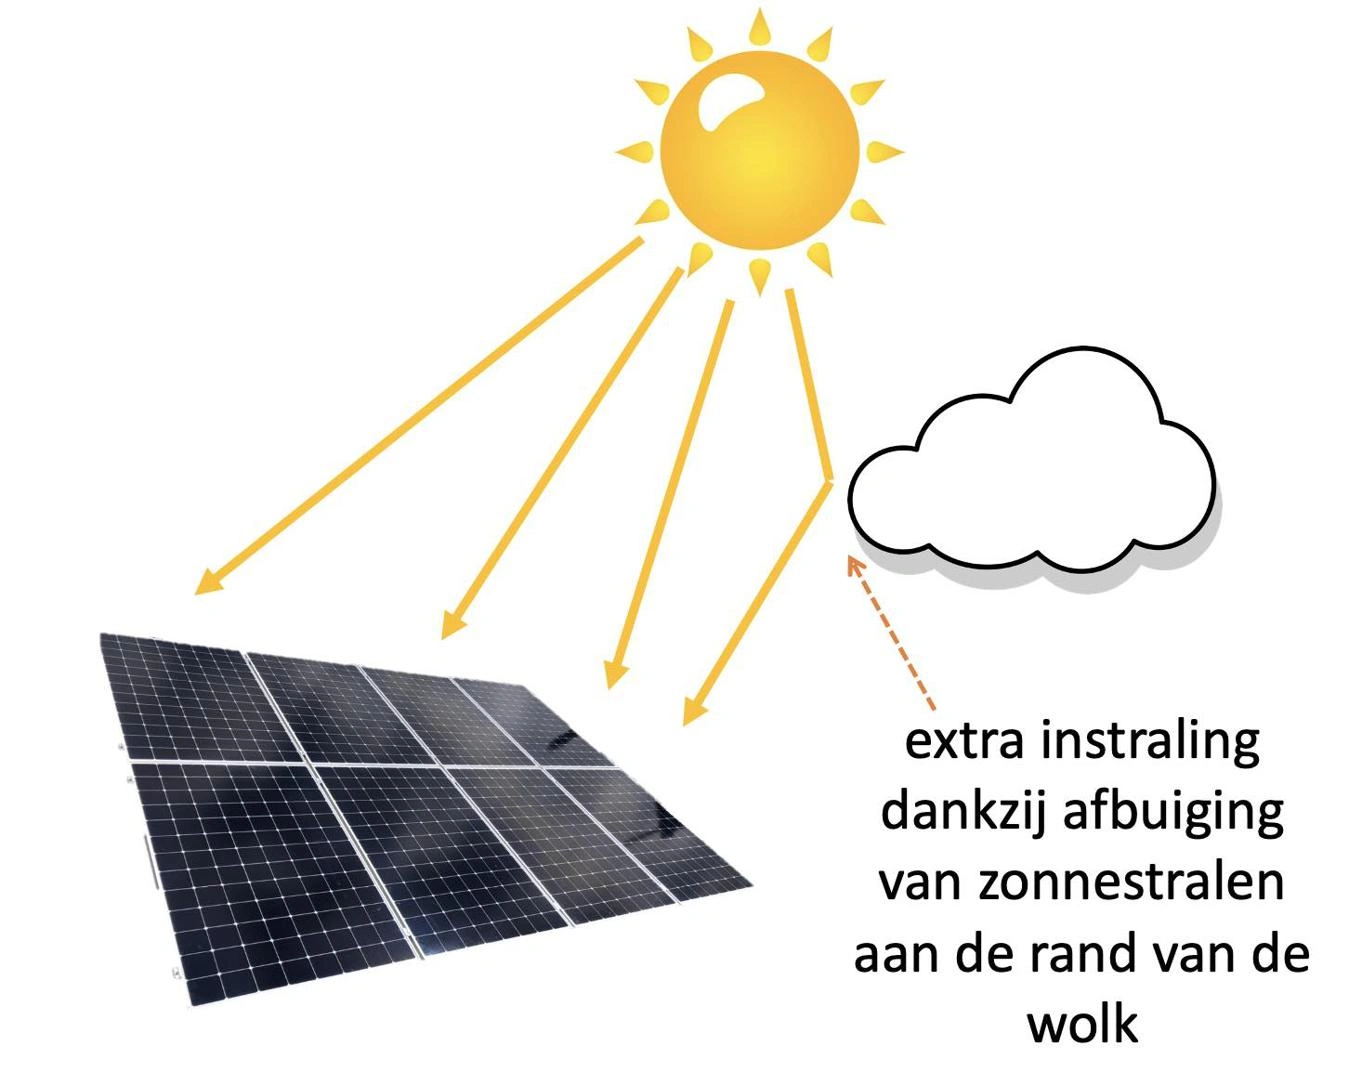
When the cloud's shadow passes, two remarkable things happen very briefly: first, the panels are still relatively cool, so when the first rays of sunlight hit them, they generate slightly more power than before the cloud passed. The second phenomenon is that the sunlight hitting the panel is not just coming directly from the sun but also includes rays that reflect off the edges of the clouds. It only lasts a short time, but during this brief moment, the panel receives an extra large amount of sunlight. Researchers from Wageningen University have calculated that the peak can be up to 22% higher than usual.
As mentioned, the ‘edge of cloud’ effect is very short-lived, and as such, it is not visible on the total power output graphs, which typically record production every 15 minutes. You will only notice it if you happen to be looking at the real-time output at the right moment. For the total production of your system, it doesn’t matter much, but if you ever notice a significant surge in power production on a day with passing clouds, now you know the reason!